|
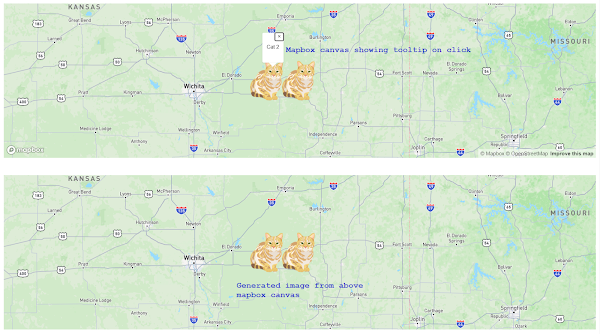
Our target is to export Mapbox as exported PNG format. Mapbox loaded into canvas, so our job get simplified. Give that map some time to load and fetch the image data when the load event is triggered. Usually there is a 'idle' event for map when we can determine that map event loaded fully. |
<div id="map-panel"> <div id="map"></div> </div> <div id="map-static"> <img src="" alt="??" id="imgTag"/> </div> |
body { margin: 0; padding: 0; } #map-panel { position: absolute; top: 0; bottom: 50%; width: 100%; padding:10px; } #map-panel #map { width: calc(100% - 20px); height: calc(100% - 20px); } #map-static { position: absolute; top: 50%; bottom: 0; width: 100%; padding:10px; } #imgTag { width: calc(100% - 20px); height: calc(100% - 20px); } |
mapboxgl.accessToken = 'pk.eyJ1IjoidGFrdX...fQ.57D0sXpw'; const map = new mapboxgl.Map({ container: 'map', style: 'mapbox://styles/mapbox/standard-beta', center: [-96, 37.8], zoom: 7, preserveDrawingBuffer: true, }); map.on('load', () => { console.log('Map.load'); map.loadImage("https://docs.mapbox.com/mapbox-gl-js/assets/cat.png", (error, image) => { if (error) { alert("Could not load image"); return; } map.addImage('cat_image', image); // Add a data source containing one point feature. map.addSource('point', { 'type': 'geojson', 'data': { 'type': 'FeatureCollection', 'features': [{ 'type': 'Feature', 'properties': {'name': 'Cat 1'}, 'geometry': { 'type': 'Point', 'coordinates': [-96, 37.8] } }, { 'type': 'Feature', 'properties': {'name': 'Cat 2'}, 'geometry': { 'type': 'Point', 'coordinates': [-96.40303, 37.8] } }] } }); // Add a layer to use the image to represent the data. map.addLayer({ 'id': 'layer-id-1', 'type': 'symbol', 'source': 'point', // reference the data source 'layout': { 'icon-image': 'cat_image', // reference the image 'icon-size': 0.15, "icon-allow-overlap": true, } }); }); map.on('idle', function () { console.log('Map.idle'); const canvasMap = map.getCanvas(); const dataUrl = canvasMap.toDataURL(); document.getElementById("imgTag").src = dataUrl; }); map.on('click', (e) => { // recognize clicked feature type console.log('Map.click'); const features = map.queryRenderedFeatures(e.point, { layers: ['layer-id-1'], }); if (features.length > 0) { new mapboxgl.Popup() .setLngLat(e.lngLat) .setHTML('<p>' + features[0].properties.name + '</p>') .addTo(map); } }); // Change the cursor to a pointer when the mouse is over the states layer. map.on('mouseenter', 'layer-id-1', () => { map.getCanvas().style.cursor = 'pointer'; }); // Change it back to a pointer when it leaves. map.on('mouseleave', 'layer-id-1', () => { map.getCanvas().style.cursor = ''; }); map.on('movestart', (e) => { console.log("Map.movestart"); }); map.on('moveend', (e) => { console.log("Map.moveend"); }); }); |
|
Check this link for more options how to control mouse click event |
Tuesday, September 19, 2023
How to Save a Mapbox GL Web Map Extent as an Image | Mapbox GL JS: Export map to PNG
Subscribe to:
Post Comments (Atom)

No comments:
Post a Comment